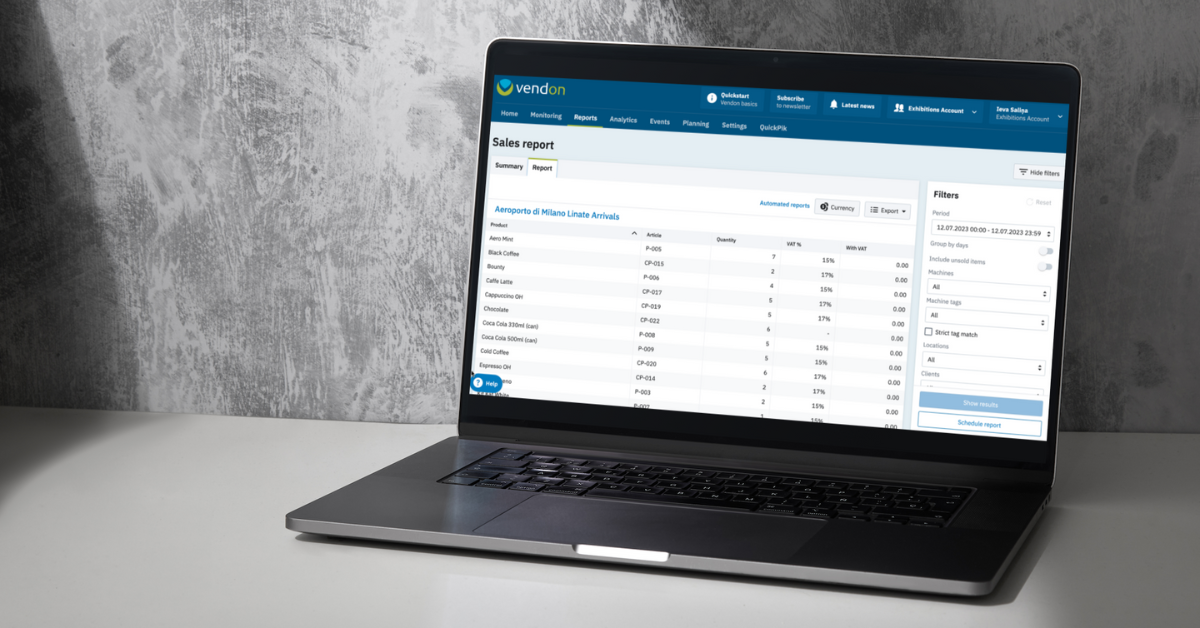
Reporting is one of the key tools in the operator’s tool belt – numbers do not lie, so it is easy to understand where the business is going. In Vendon Cloud, each customer gets access to a comprehensive list of reports – from transactions to aggregate data, to refill history and downtime analysis. Yet, the sales report remains everyone’s favorite, as it presents a quick and efficient overview of product sales across the machine fleet. After the redesign, the report has become even easier to use, allowing you to get the information you need in a matter of seconds.
Here are some of the features we believe to be its greatest assets – read on to find out how to make the most out of the sales report and what it can do for your business goals.
Control sales results
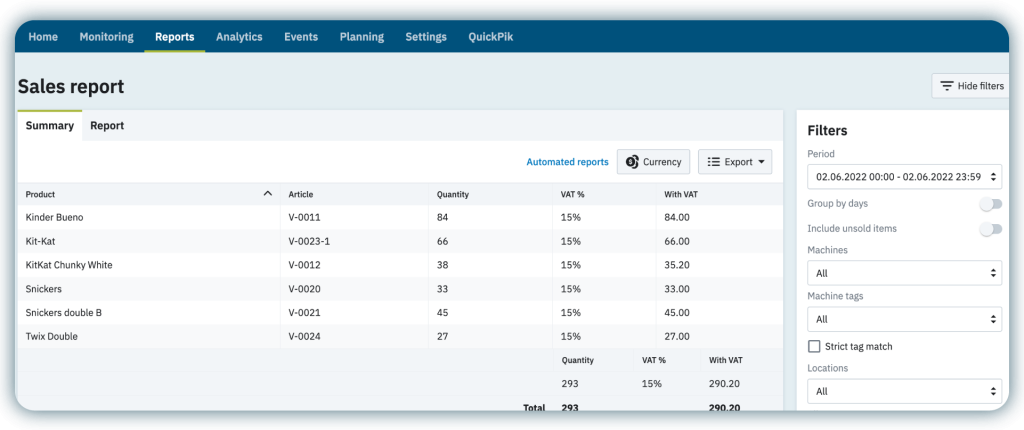
The Vendon Cloud sales report is a product-focused report – it displays sales count and revenue by product, both on the machine level and as a total value.
For instance, you can easily learn that today 50 bottles of a specific drink have been sold, bringing in 140.50 EUR in revenue as this data is provided as soon as you open the report.
What’s even better – you can drill into the sales split by product for each machine. This data can be used for further analysis of the sales your machines are bringing in and serve as the grounds for adjusting your machine planograms. Apply filters to get a more specific data set, like product sales in a specific location, or sales of a certain group of products (known in Vendon as product tags).
In case your machines are placed in multiple countries operating in different currencies, use the handy inbuilt currency converter to get accurate data in a single base currency.
Compare day-to-day performance
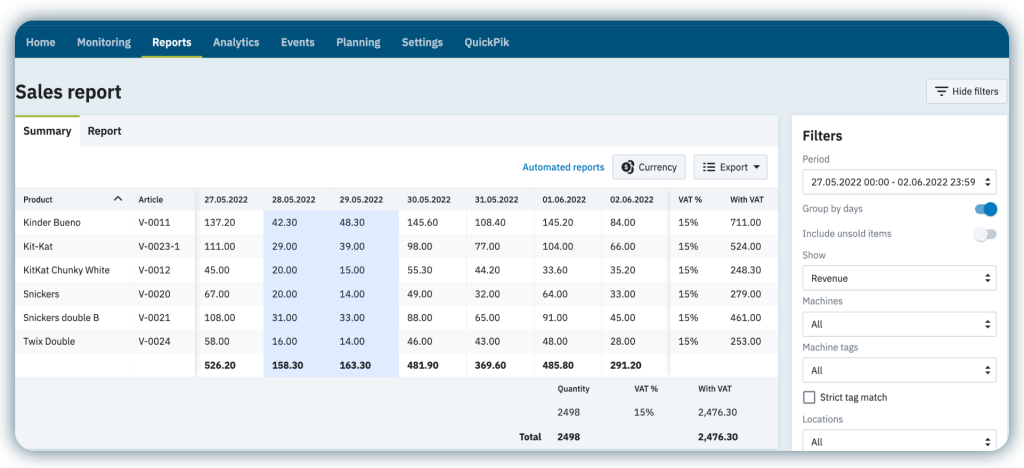
Another neat feature of the sales report is the possibility to view the same data split by day. To achieve this, simply use the setting “Group by days” when you’re applying filters, and we will take care of the rest. If you look at the data from this angle, you can spot patterns – that in turn can help you plan promotions on days when you notice regular sales slumps or adjust the refill schedule so that the machine is always full on the days when sales are at their highest. For your convenience, weekends are neatly marked in a different colour so you don’t get worried about sudden drops in sales.
Identify unpopular products
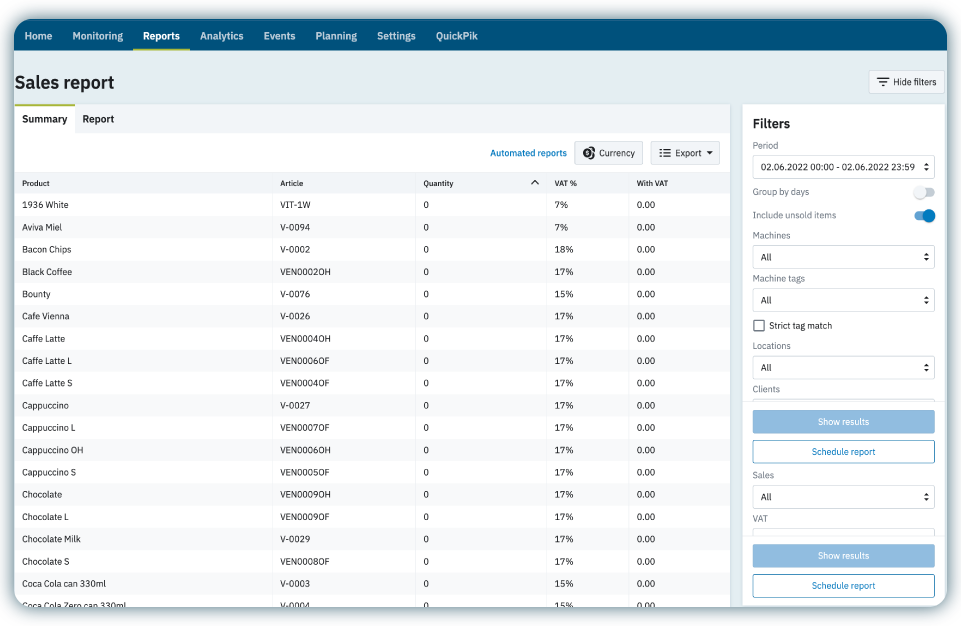
Best-selling products always bring a sense of accomplishment but it can be difficult to guess the consumers’ preferences, and some items sit unsold in the machines day in and day out. With the sales report, finding out the culprits is as easy as one-two-three. Use the setting “Include unsold products” in the filter pane to include products that have not had a single sale within the specified time period. As products are sorted alphabetically by default, simply click on the column “Quantity” or “With VAT” header and get a list of products sorted by popularity.
Facilitate invoicing
If your business model involves customers that you invoice based on product sales, the sales report is an excellent tool for invoicing as it provides sales by product as well as the total numbers. The final report can be exported as an Excel spreadsheet or a PDF document, which you can easily attach to the final invoice.

Receive automated reports
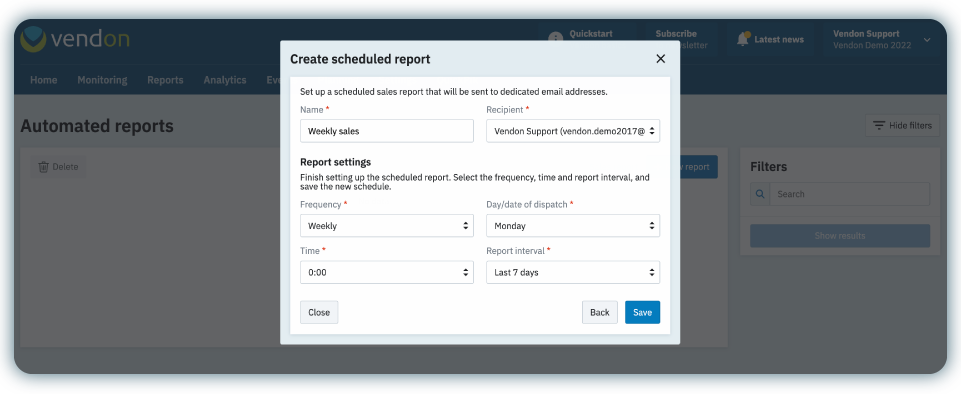
One of the best features of the sales report might be report automation – in simpler terms, we can send reports at predefined intervals to your inbox. Receive daily, weekly or monthly reports about yesterday’s, this week’s or last month’s performance. There’s an ample selection of filters available so that you can tailor the report to your exact needs; for example, send a report to your customer about their machines only, or set up a schedule for the management team. When they arrive at the office on Monday morning, the report will be waiting in their inbox.
Start optimizing your vending business today and boost your revenue – get in touch with us at grow@vendon.net or your local distributor.
