Margins in coffee operations are built on small numbers.
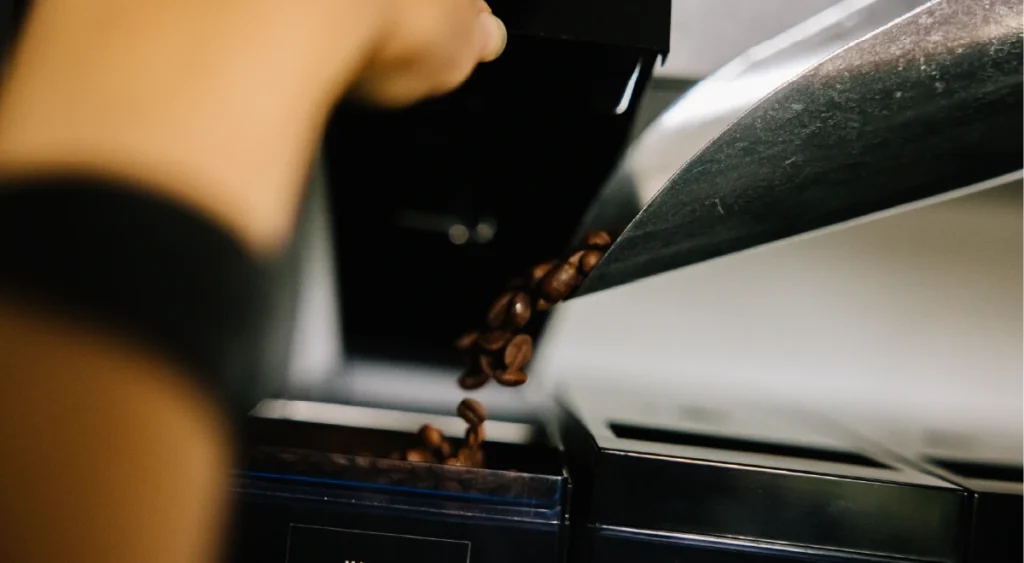
A few grams of coffee per drink.
A splash of milk.
A few extra seconds per cycle.
Individually, they don’t seem critical. But across hundreds of machines and thousands of drinks, they add up to something operators rarely see clearly:
waste that directly reduces revenue.
Not because operations aren’t well managed—but because this layer of the business is simply hard to track without the right data.
In one real operation, telemetry revealed hundreds of liters of milk and tens of kilos of coffee lost without anyone noticing unusual activity.
How telemetry helps uncover waste and stop revenue leak
Most waste in coffee operations doesn’t come from obvious mistakes. Use the checklist below to quickly assess where waste may be happening in your operation.
1. Overstocking ingredients → waste before sale
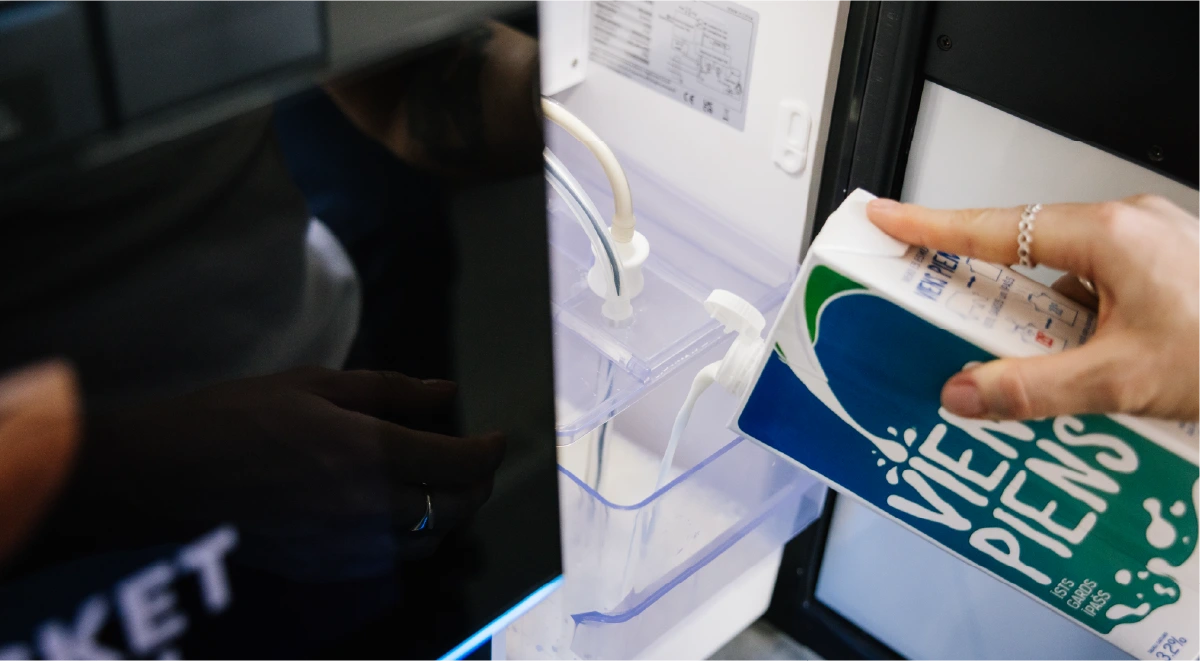
In coffee operations, fresh ingredients like milk have a short lifecycle. In practice, operators can lose 5–15% of milk due to overstocking and low turnover at certain locations.
Milk expires. Ingredients sit unused. Cash is tied up in products that never generate revenue.
What to do:
- Stock based on real machine consumption
- Adjust per location, not assumption
- Reduce expired products
Result: more of what you buy is sold → less waste, more revenue.
2. Downtime → lost sales and wasted ingredients
Unplanned downtime can reduce equipment productivity by 5–20%.
But downtime also creates hidden waste.
Machines with issues can:
- Use ingredients without delivering drinks
- Run inefficient cycles
- Stay inactive while holding stock
Without data, this goes unnoticed.
What telemetry shows:
- When machines consume without selling
- Where performance drops
- Which issues affect both sales and stock
Result: faster fixes, less waste, more consistent sales.
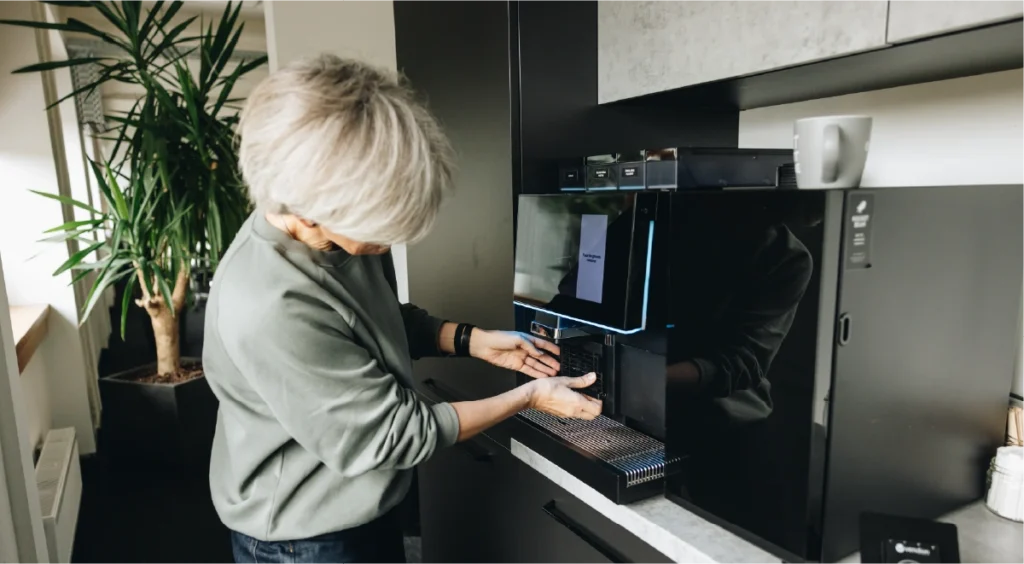
3. Cleaning patterns → small habits, big impact
Cleaning is necessary—but often not controlled.
Across machines, you’ll see:
- Different routines
- More cycles than needed
- No clear visibility into usage
Every extra cleaning cycle uses water, milk, and coffee—without generating revenue.
What to do:
- Track cleaning frequency
- Compare across locations
- Standardize routines
Result: less unnecessary consumption → more ingredients used for actual sales.
4. Recipe drift → margin lost in every cup
Adjusting brewing parameters can reduce coffee use by up to 25% per drink.
A slightly higher dose per drink is almost impossible to notice manually.
But over time, it becomes one of the biggest hidden losses.
What to do:
- Monitor ingredient usage per drink
- Compare machines across locations
- Keep recipes consistent
Result: same selling price, lower cost per cup → stronger margins without changing volume.
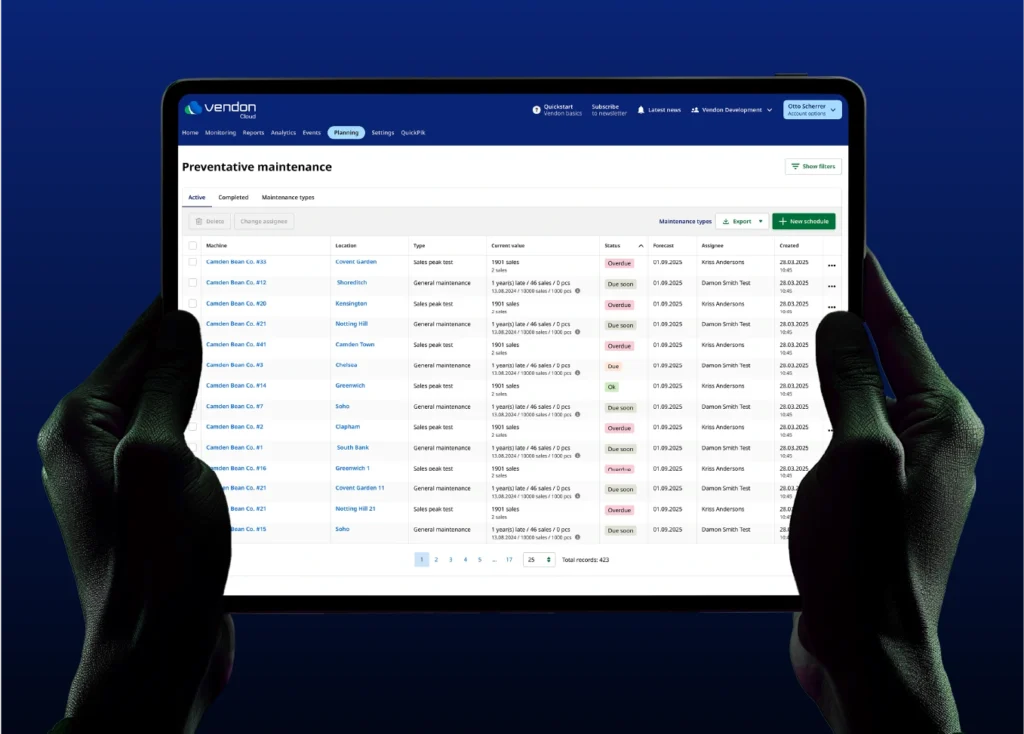
5. Service and routes → activity vs performance
Predictive maintenance can reduce maintenance costs by up to 25% and breakdowns by 70%.
Route optimization can reduce travel distance by 10–30%.
Many operations are active—but not always aligned with real needs.
- Visits happen too early or too late
- Service is scheduled by routine
- Time is spent where it doesn’t impact sales
What to do:
- Refill based on actual consumption
- Service based on real issues
- Build routes around machine performance
Result: better machine uptime, fewer missed sales, and more revenue from the same fleet.

How one company uncovered hidden waste in just two weeks
If you want to see how this looks in reality, this case shows it clearly:
How telemetry unveiled 660 liters of milk waste and 70kg of coffee beans missing
In just two weeks, telemetry uncovered:
- Ingredient losses that had gone completely unnoticed
- Cleaning and usage patterns driving unnecessary consumption
- A clear mismatch between what was used and what was actually sold
This is what happens when you move from assumptions to data.
Once you see what’s really happening inside your machines, waste stops being invisible—and becomes something you can control, reduce, and turn back into revenue.


")