It’s sometimes difficult to motivate yourself to start using new tools – they don’t feel familiar, they look complex, and there’s just no time to learn. Yet, it might also mean you are missing out on a great product. Our Report Generator was redesigned recently to help Vendon customers master the ropes quickly and see the benefits of this report immediately. This has been appreciated by many customers who’ve jumped at the opportunity to get better insights into their sales data.
If you’re still unsure how to start, here’s a little nudge. Read our blog and learn how to navigate the report generator to get the information that will help you make data-driven business decisions.
Sample reports to get you started
The report generator is exactly what it sounds like – it allows you to generate all kinds of customized reports spanning large periods of time, like months and years. That’s why it is empty as you walk in for the first time, as there are no reports for you to download yet.
If you’ve made it this far and explored the space, you will see something under Templates – a few sample templates we’ve put on your account so you can start reaping the benefits immediately.
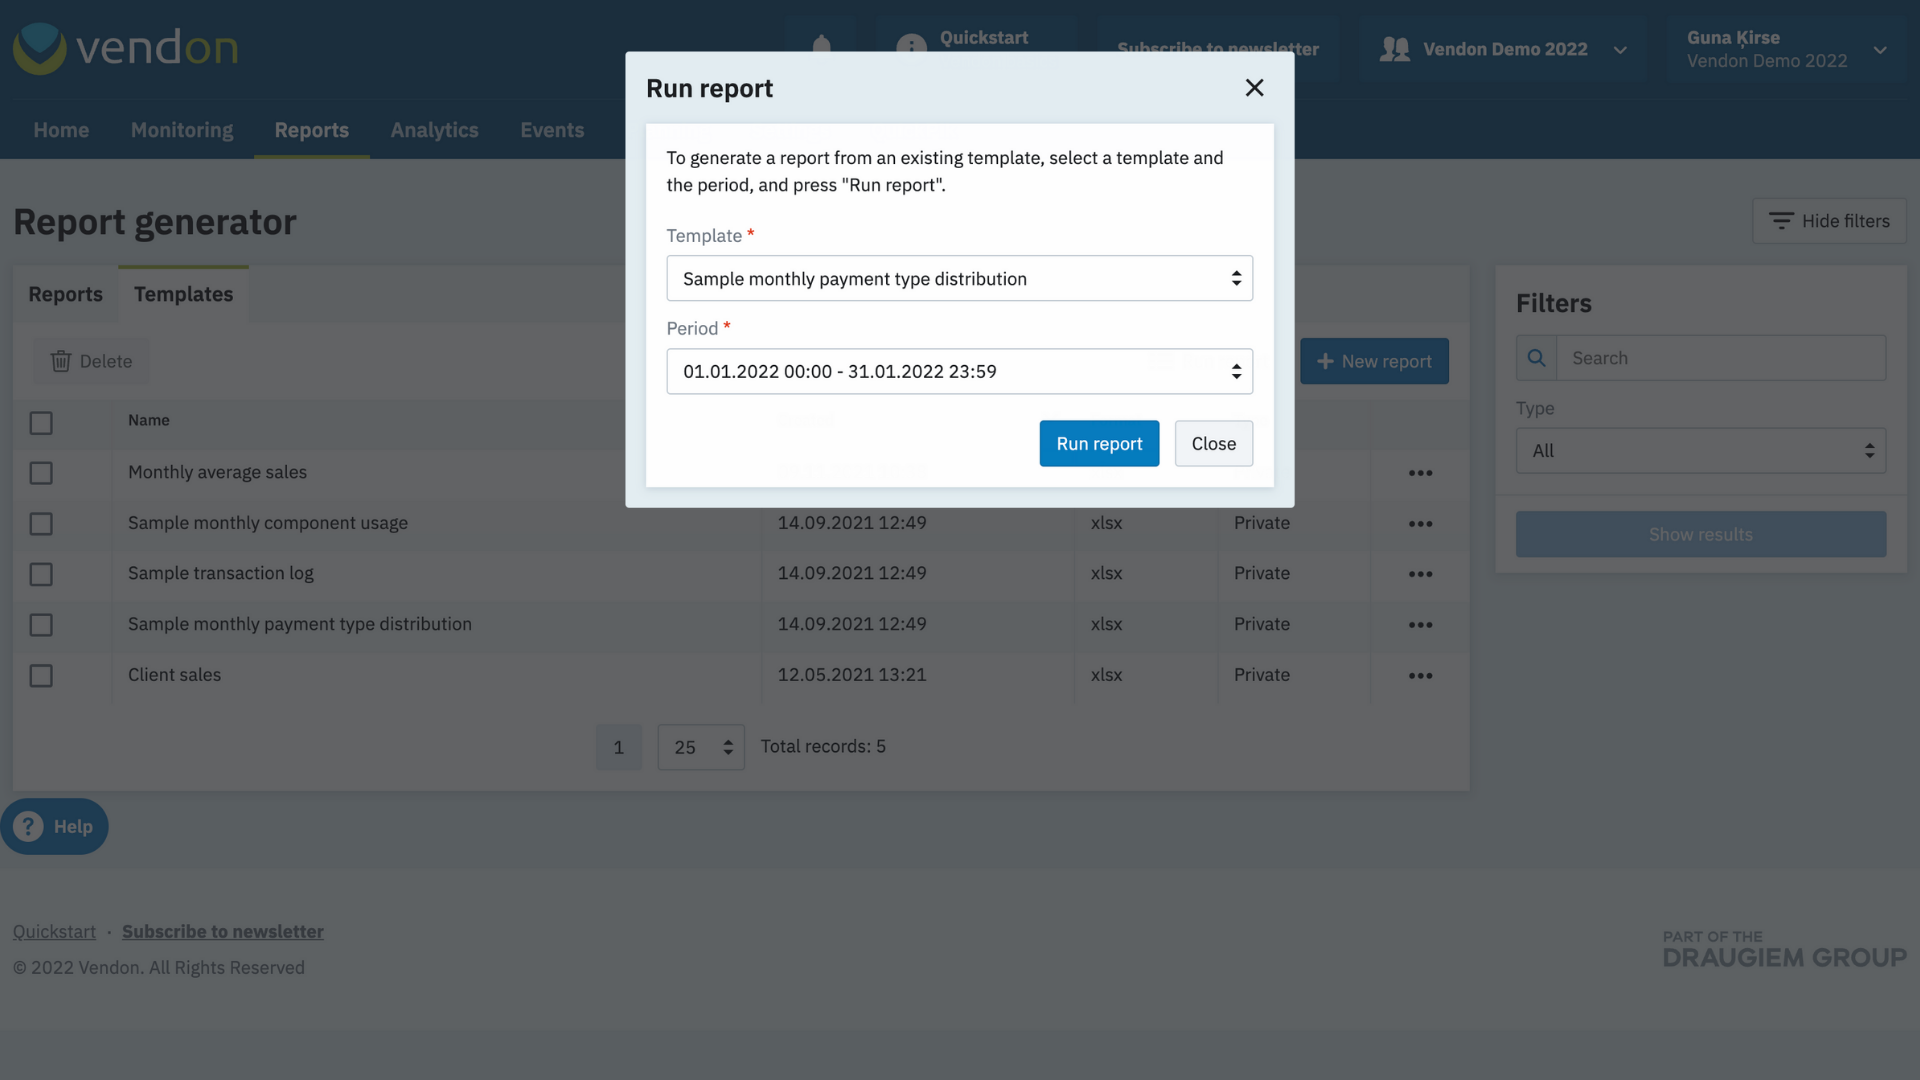
Try downloading the Sample monthly payment type distribution report. Click on “Run Report”, select the template and the period (the previous month, for instance) and hit the blue button.
The report will start generating right away. In the end, you will be able to download a report with your data on how well your machines have done in terms of various payment methods. This can help you understand whether cashless is starting to outperform cash and you should think about equipping more machines with a cashless solution, for instance, the Vendon Contactless reader.
Once you are comfortable with these sample templates, you can begin creating your own. That way, whenever you need particular data, you can always come back to the report generator and download a fresh report.
Group data for a new perspective
The Vendon IoT and telemetry platform is largely based on the machine as the most important element. While in most cases it’s completely justified (for instance, it’s the machine that might have power issues or might have run out of Snickers).
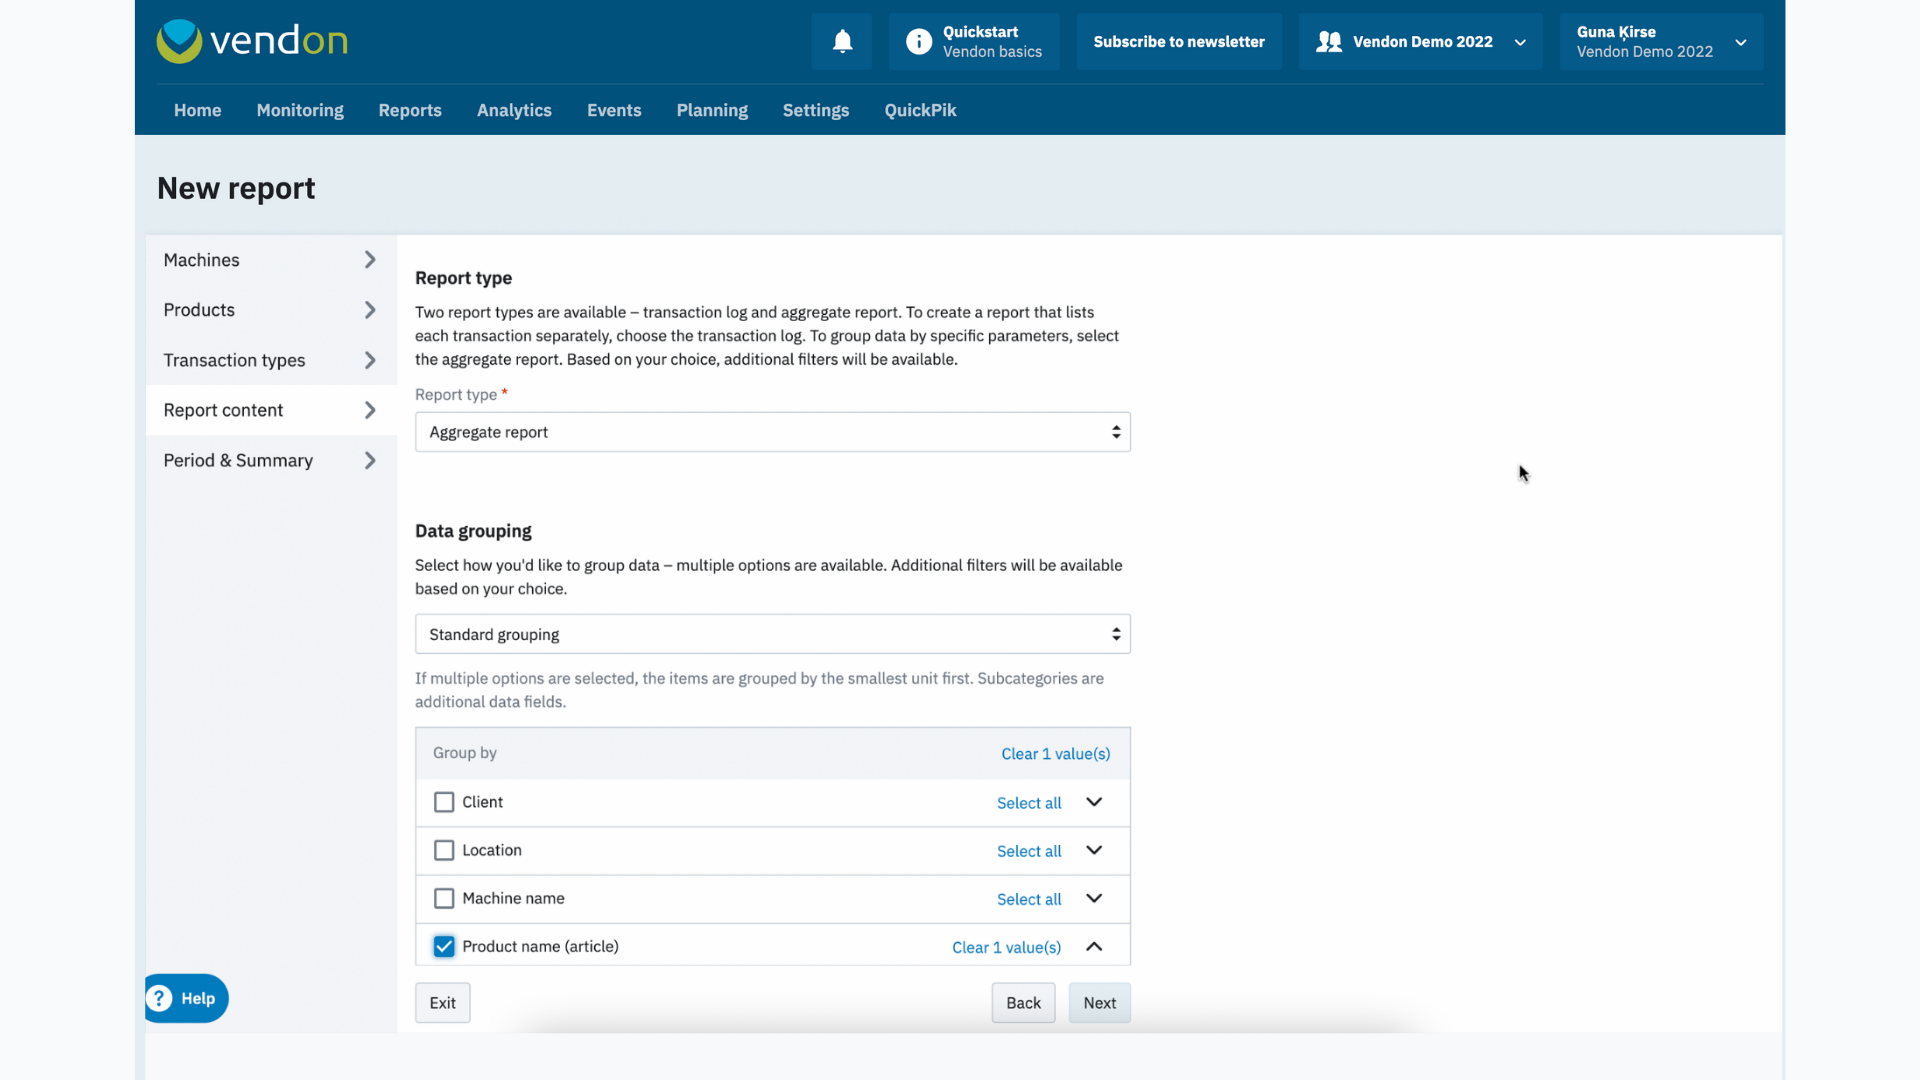
when it comes to sales information, it’s great to group data by other parameters – such as machine tags, locations, or clients. With the report generator, it’s easy to do so: when you create a new report, select “Aggregate data” as the report type and choose how you’d like to group data – there are multiple options to select from. You can even group sales data by the area manager, or focus solely on product groups (marked by tags) to understand if it’s chocolate bars your customers like, or if they’d sooner go for muesli bars as the afternoon pick-me-up.
With this information at hand, it’s easy to spot underperforming locations, top customers, and customers’ least or most favourite products, which is not as clear when data is grouped by machines only.
Identify costs and compare profit
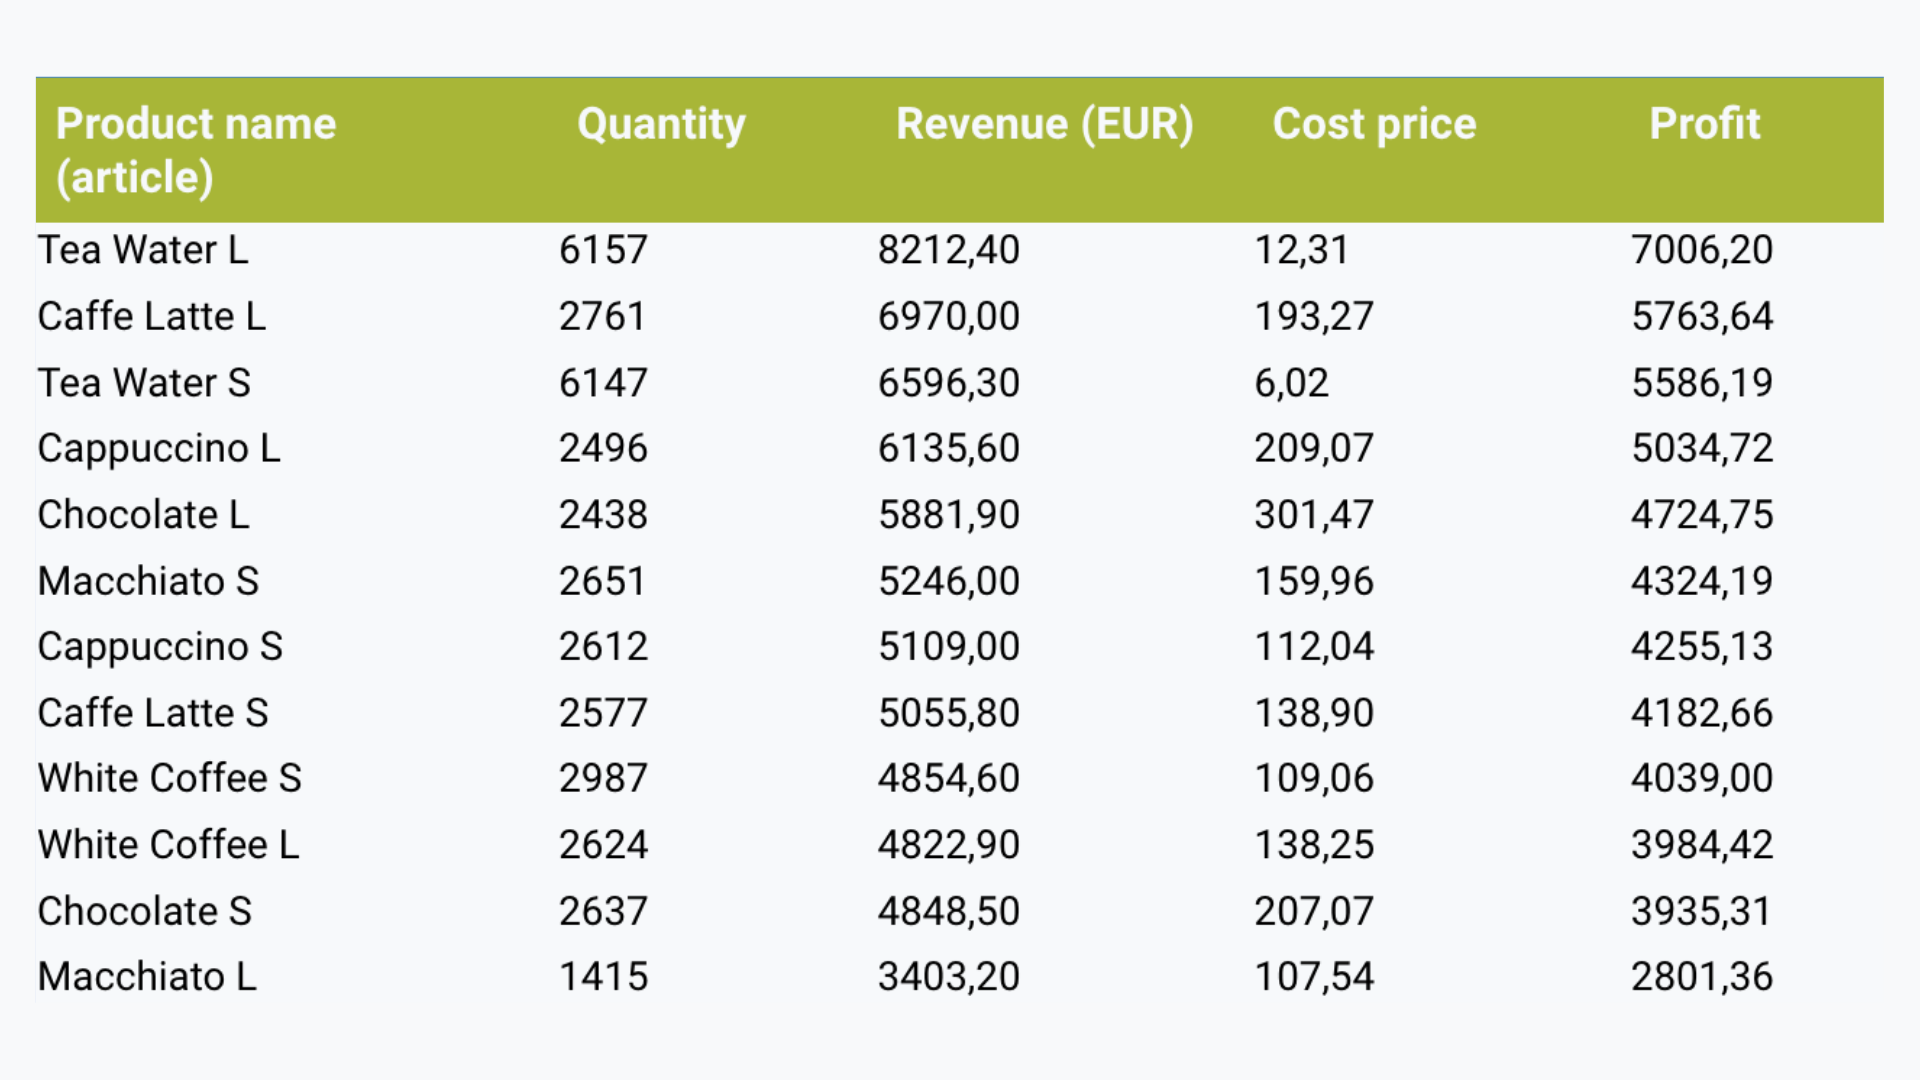
The report generator is the perfect tool for looking at sales data not only in terms of the revenue each product generates but also how much it costs to you and what you actually earn on each sale.
To start with this, make sure your account has the Cost Price functionality enabled (if you edit any product under Products/Components you should see a cost price field there). If not, reach out to your distributor. Note that once you enter the cost price of the product, we will start calculating your profit but it will not affect the historical data so you might need to wait a bit for the data to accumulate.
In the report generator, you can either retrieve the cost and profit of any individual sale or look at this information on the product level. To do so, go with the Aggregate report type, select Group by product name, and then the values you’d like to sum, like the cost price, revenue, and profit. Include quantity as well – that way, you’ll be able to quickly gauge which products have a low-profit margin and which generate considerable profit despite lower sales volumes.
Calculate averages to check KPIs
It’s likely that you have KPIs that you’d like each machine to reach but looking at individual days can give an incorrect picture – sales may fluctuate based on all kinds of reasons. Calculating averages over a longer period of time makes it easier to determine whether machines are meeting their sales targets. Report generator to the rescue!
When you create aggregate reports and choose to group data by week up to year, you can opt to calculate averages – in terms of sales, revenue, costs, or profit. Here’s an example: select Month as the grouping period and mark Calculate averages, then select Daily average. As the reporting period, select the previous month. In the output file, you will get the daily sales or volume average over the course of the month. From there, compare it to the expected KPIs and act accordingly.
Build further reports and visualizations
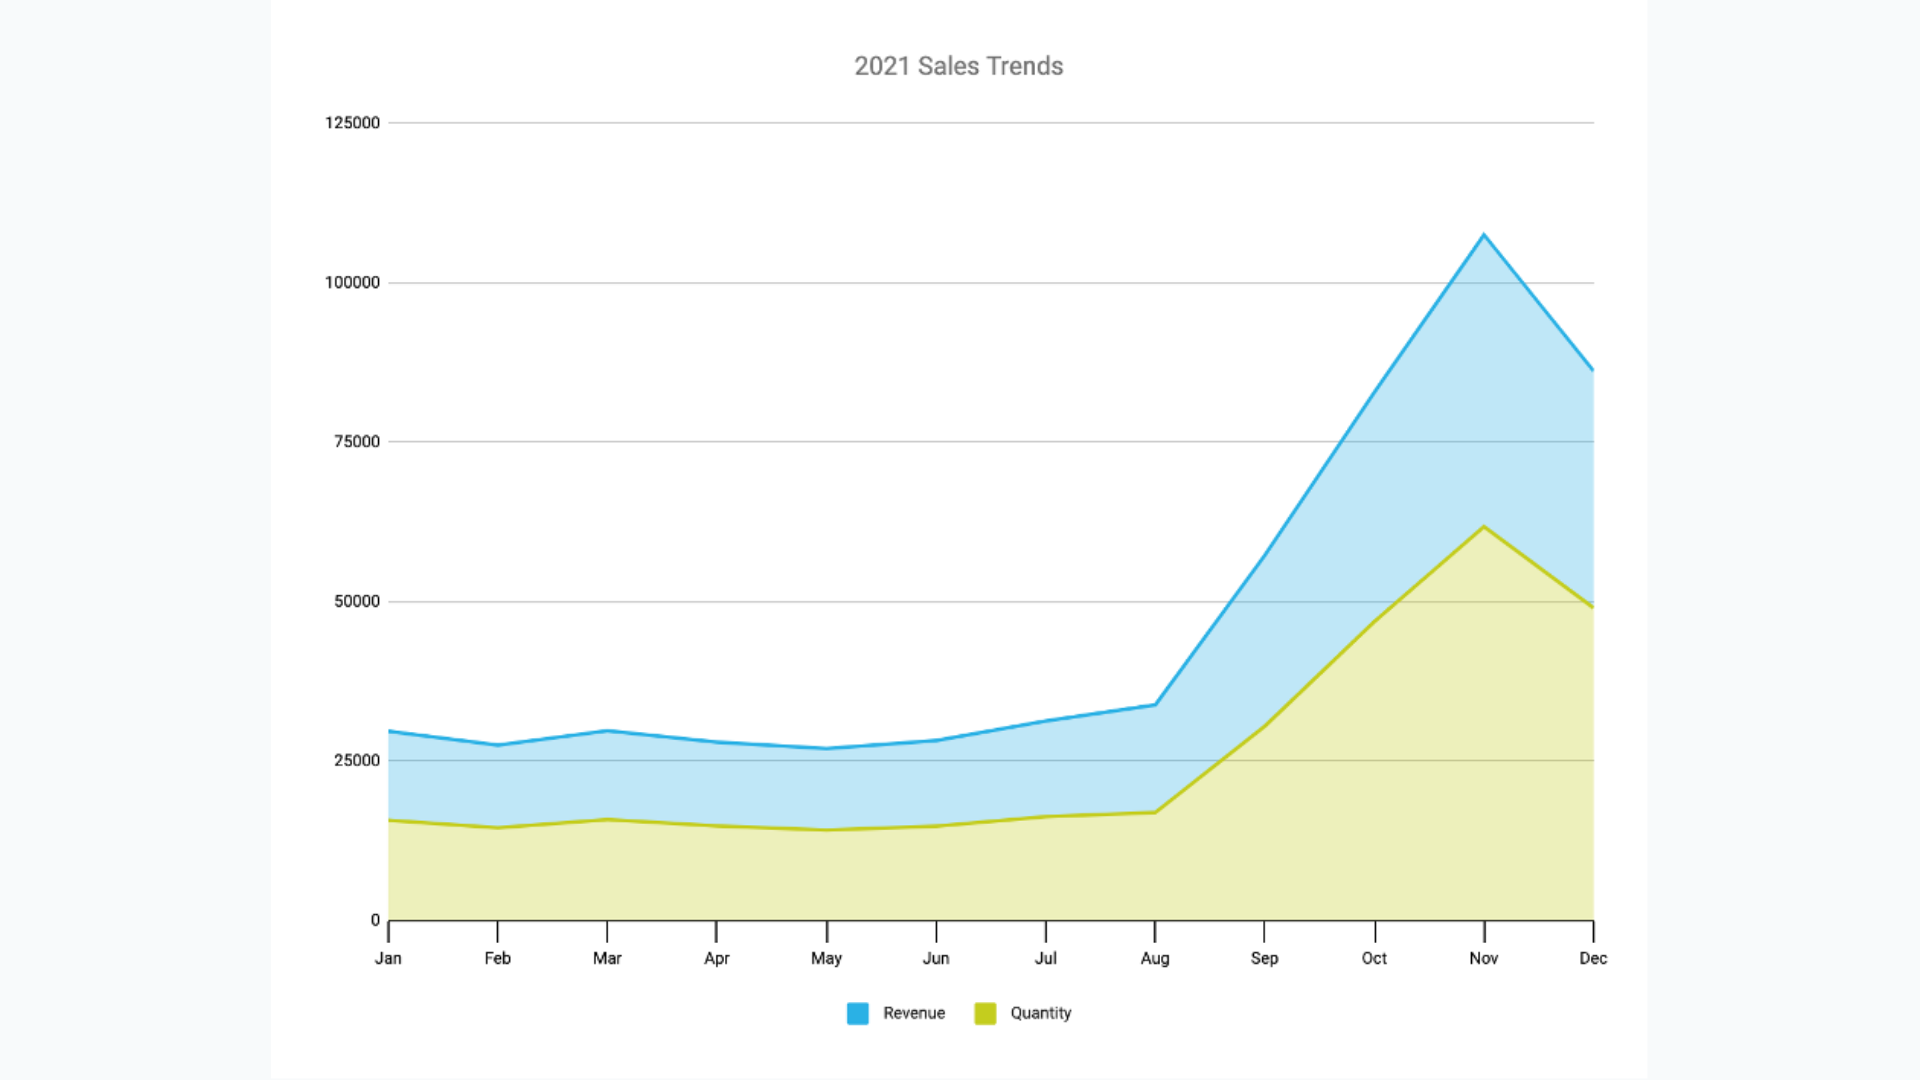
When you download reports from the report generator, you will notice that they look just like regular Excel files – no frills, special headers, or formatting applied. And there’s a good reason for that: these files are ideal for further analysis or data visualization thanks to the convenient report format. Feed them into your ERP, use pivot tables, and create charts to get a visual overview of your sales results. The benefit of this solution is the date range that you can select; the report will be prepared in the background and you can come and download it within seven days after its completion. Thus, you can see and analyze trends and make year-on-year comparisons with little effort.
Start optimizing your coffee or vending business today and boost your revenue – get in touch with us at
grow@vendon.net or your local distributor.


")